
Conducting a sea trial is a necessary step upon delivery of a ship. This activity not only documents and validates anticipated ship speed and power, but if done correctly also provides performance data that can be useful for design purposes. The same holds true for underwater vehicles in general and thrusters in particular. However, while gathering data may seem easy, extracting useful trial data for typical UVs can often be pretty challenging.
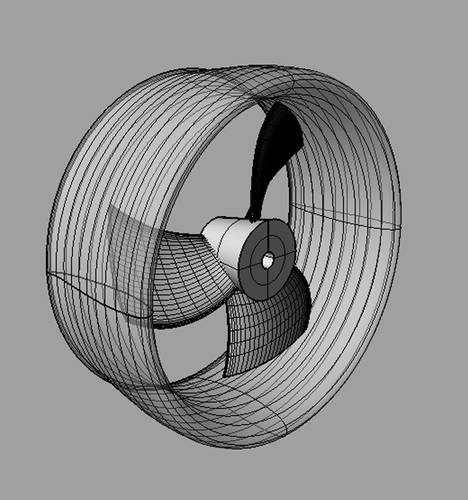
We should start with an understanding of the system – the Vehicle-Propulsor-Drive system. For “transit” UVs whose mission is to move itself (doing survey work, for example), it is the drag of the Vehicle body and appendages that establishes the load on the system. The Propulsor – an all encompassing term for the thruster propeller and nozzle (when used) – provides the thrust needed to overcome the drag at a particular speed. The Drive spins the Propulsor at the necessary RPM to generate the right amount of thrust. The power generated by the Drive is simply that which the Propulsor requires at the RPM under the particular test condition.
As most transit UVs currently use electric motors as their Drive, it is easy for the controller to document RPM and current draw. In most tests Vehicle speed can be captured, which we will see is needed to determine system performance metrics. This set of data is pretty thin if you want to make any real conclusions about performance. But all is not lost…
System Simulation
Let’s consider what performance metrics are needed to fully describe a functioning system. As mentioned, the Vehicle characteristics and speed are responsible for the drag load on the system. The Propulsor produces a suitable thrust at a particular RPM, and presents a torque (i.e., the blade’s rotational drag) to the Drive. Electrical input power (from voltage and current) produces a matching output shaft torque in the Drive. In an ideal setting, each piece of the system would be directly measured and documented:
Mechanical: Vehicle drag, Propulsor thrust, Propulsor torque, Drive torque, Drive electrical input
Operational: RPM, Speed
The regularly measured items are in bold, so as you can see, we have a lot of critical knowledge about the UV’s performance that is undefined. For example, improvements in battery budget can come from reduced Vehicle drag, or greater Propulsor or Drive efficiencies. But we need to determine the missing pieces before we have any chance to improve the system components.
If we cannot directly measure these missing parameters, can we predict or estimate them with sufficient fidelity to be useful? Fortunately, in most cases the answer is yes.
Drive motor efficiency
While electrical input power is interesting from the standpoint of battery usage, the system performance needs the output mechanical shaft power. The ratio between the two is the motor efficiency, and we want the highest efficiency at the operating condition for the least demand on the batteries.
(Quick sidebar: Be careful about how torque and power are used to describe Drive performance. Torque is a specific metric at a particular RPM. Power is a much better way to communicate energy transmission. This is particularly true when talking about electrical input power versus output mechanical shaft power.)
Two key points regarding motor efficiency are that a) motor suppliers generally indicate motor efficiency only at full load and a particular RPM, and b) Propulsors almost never draw full shaft power from a Drive. Electric motor suppliers typically do not provide a full efficiency map (such as the one shown below) that quantifies the effect of partial load and RPM. That said, we do have means to estimate partial load motor efficiency so that we can predict the torque being developed by the Drive – and this should match the torque required by the Propulsor.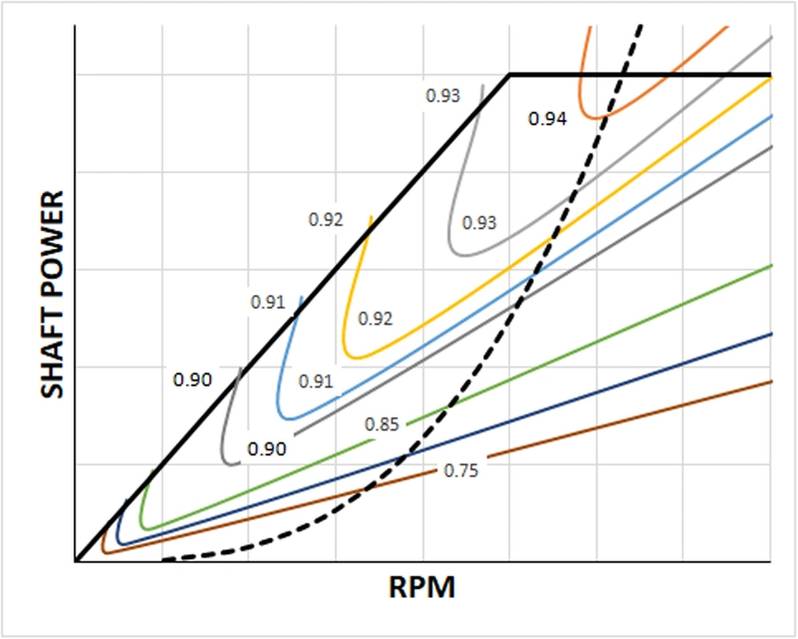
So, the operational partial load motor efficiency is an important piece of information for design. For additional information about electric motors for UV applications, let me refer you to our earlier article in the March 2020 issue of Marine Technology Reporter.
Propulsor thrust and torque
How can we derive or estimate Propulsor thrust and torque given the little test data available? For this we will use the known performance characteristics of the Propulsor as a “numerical dynamometer” to predict thrust and torque. However, for an accurate prediction we need accurate test data for RPM, Speed, the Vehicle-Propulsor interaction coefficients (particularly wake fraction), and the thrust-torque performance coefficients for the Propulsor.
In the absence of a direct empirical determination (such as model testing), the interaction coefficients and Propulsor performance coefficients must be analytically derived. CFD computations from an experienced source could be used for this purpose, as are predictions from “simplified-physics” computations such as those found in the NavCad® software (for system simulation) and PropElements® software (for open and ducted propeller analysis).
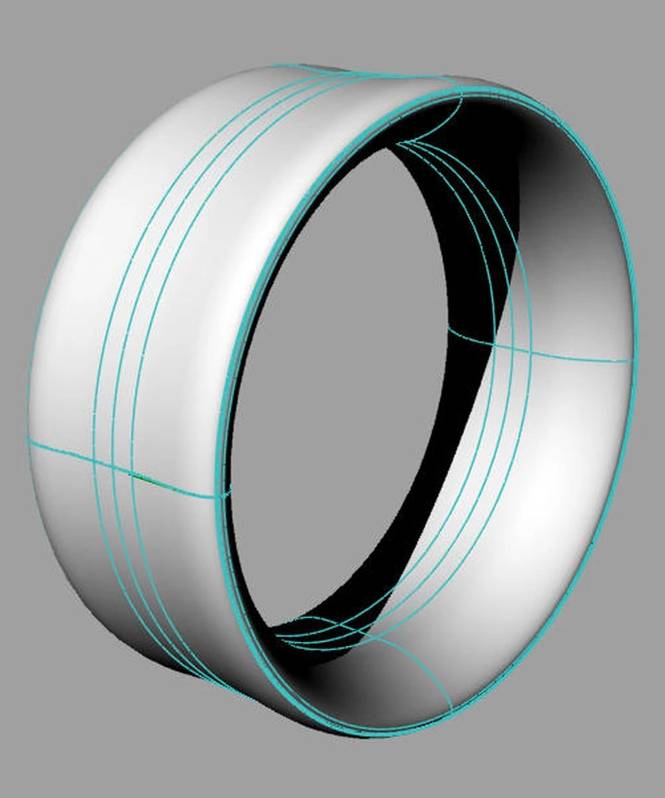
Let me caution, however, about the use of popular propeller series (such as the B Series or Kaplan ducted propeller series) for prediction of Propulsor performance. In short, there is such a divergence between traditional series and contemporary UV propeller, nozzle, and stern shape geometry that their use cannot be justified without some calibration or alignment. For example, blade area ratios are typically below the data set of these series, and their small diameter is subject to scale effect differences. Contemporary nozzle styles are not like the traditional geometries, and in many cases, nozzles are just protective shrouds that do not contribute any thrust-making benefits. (Two examples of contemporary nozzle/shroud geometries are shown below.) Stern shapes are often subject to a steep inflow angle into the Propulsor that is not picked up by the uncalibrated use of traditional series.
Predicting the Propulsor component performance with CFD or a tool like PropElements avoids these shortcomings, and in fact can develop the calibration corrections for improved prediction using a traditional series. With some care the Vehicle-Propulsor interaction can be predicted and a suitable Propulsor performance model can be developed. These will then allow for prediction of the Propulsor thrust and torque at each test condition.
Vehicle drag
The Propulsor thrust (as determined above) then can be used with the Vehicle-Propulsor thrust deduction interaction coefficient to determine the Vehicle drag at that condition. By conducting the tests and running the simulation for a variety of speed and RPMs, you can develop a drag curve for the particular body and appendage design.
A system simulation for design
Even under the best of circumstances the test simulation may still contain some uncertainty in the system’s various performance metrics. But this is OK because improvement in design is principally a qualitative (or comparative) exercise where we want to see if one variation is better than the other. A robust system simulation with suitable models for prediction of the individual components should be both accurate and faithful to the potential improvements or changes being considered. Capturing test data and deriving performance metrics offers significant knowledge for any UV developer interested in improving their Vehicle, Propulsor, or Drive design.
Full article available at here via Marine Technology News.